Consuming wasted resources in large clusters
Josh Hyman (802-971-681)
Abstract
In large clusters, it seems that many resources (such as memory, disk, CPU cycles, network I/O, etc) are wasted. I have begun to explore one possible reason related to users over estimating their process' needs. For this project I will look into dynamically scheduling "small" tasks to use the remaining available resources in the cluster, though fragmented across machine boundaries. This problem is very similar to the problem addressed by Condor1 -- trying to use spare CPU cycles on idle workstations for useful work. If such "small" tasks could effectively use these fragmented resources, then the overall resource utilization in the cluster would increase. The goal of this project is to define the required properties of a "small" tasks and a policy for statically and dynamically scheduling them on a cluster.
Background
Logical units of computation are generally submitted to a cluster in the form of a job. A job consists of a set of one or more heterogeneous tasks, where each task may have one or more instances within the cluster and is represented by exactly one binary. For each type of task, the user will specify the resources required to run that task on any given node. These requirements generally specify the amount of memory and disk space needed, number of CPU MHz required, and possibly I/O bandwidth for each of the tasks which make up any particular job. The user submits these requirements, along with the binary, to the cluster management software which tries to schedule the job by reserving the needed resources on various cluster nodes. By accepting the job into the cluster, the manager has entered into a contact with the user. It promises to provide the requested resources to each task regardless of external load on the cluster. It may choose to preempt the task or move the task, but while the given task is running, it will have access to the requested resources. On the flip side, the task also is required to not to use more than the allocated amount of resources. Should the task overstep it's bounds, the cluster management behavior becomes undefined. Specifically, the manager will do what ever is easiest, which can range from nothing to killing the task out right.

The most important part about this contract is the fact the the manager has assured the user that as long as the task is running, the resources will be available. Specifically, this means that the scheduler can not over-allocate a given resource. A combination between this requirement of the scheduler and allowing the user in the to define a given task's requirements leads directly poor overall resource utilization.
Problem Statement
Many cluster resources are wasted either because they are allocated by tasks and remain unused, or they are fragmented into unusable pieces and scattered across the clusters. This is the manifestation of two separable problems. First, users have a difficult time correctly defining the requirements of a given task. And second, even with all jobs utilizing their entire allocation and perfect scheduling, fragmented resources would still be present. These problems lead to under utilization of cluster resources, and, and the limit, may lead to a cluster unwilling to accept new jobs which it actually has the resources to complete. Assuming that the first problem of poorly defined allocations can be solved by better educated users, better written applications, or more intelligent cluster management software, I will focus mostly on the second problem of fragmentation.
Current Situation
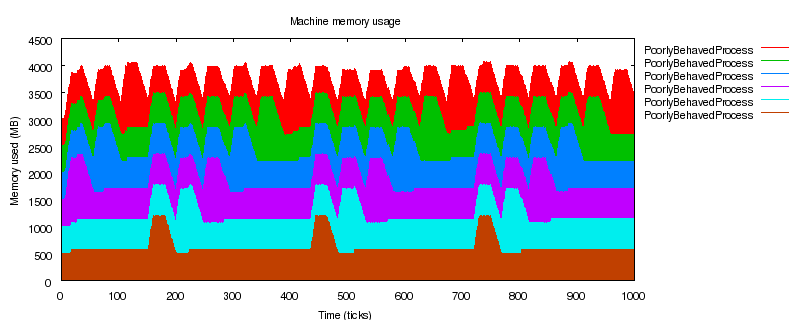
For this discussion, I have chosen to examine memory usage because memory is a sufficiently scare resource which is quite easy to measure. Another scare resource of interest might be I/O latency (the time between issuing an I/O request until when the kernel begins to service that request). However, measuring such delays is much more complex and begins to deal with 
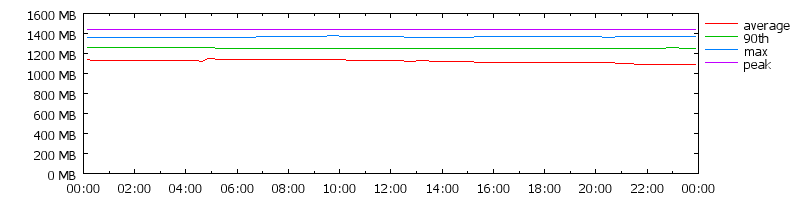
Quality of Service (QoS) issues. Figure 1 shows the typical memory usage patterns over the course of 24 hours for a large (few thousand machine) cluster. This cluster has not yet reached capacity, however, there is still a significant difference between reserved and used memory. Note that any blip in total memory is generally caused by more racks of machines being powered up.

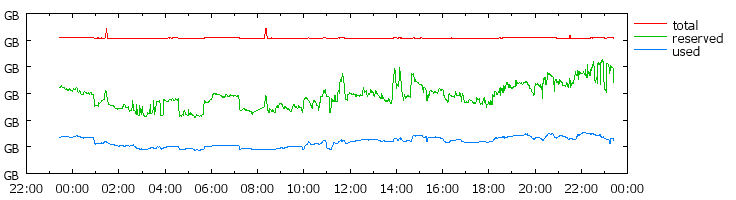
Figure 1: Memory usage of a typically loaded cluster
(note: measurements taken from a Google cluster with consent.
The scale is omitted, but on the order of the 10000s of GB)
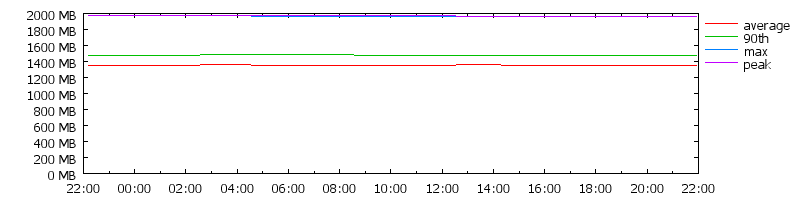
In contrast, figure 2 depicts a very overloaded cluster in the sense that it cannot readily accept new jobs. However, even though the scheduler would not be able to guarantee resources to incoming job requests, there is a significant amount of memory unused. Approximately 20% of the total memory of the cluster is actually being used by running processes, 70% is allocated but unused, and the remaining 10% is fragmented. Such a cluster could be regarded as a degenerate case, but there seem to be many clusters who's memory usage look like figure 1 or a hybrid between figure 1 and figure 2. This suggests that clusters tend towards significant under-utilization of memory.

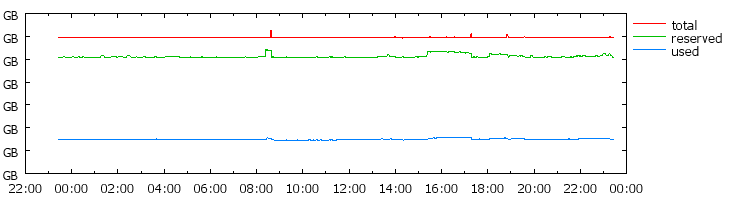
Figure 2: Memory usage of a over loaded cluster
(note: measurements taken from a Google cluster with consent.
The scale is omitted, but on the order of the 10000s of GB)
The large unused amount of memory in figure 2 is due to gross over-estimations of the resource needs of many tasks. However, even if there were only a negligible difference between used and reserved, there would still be a significant amount of fragmented memory. Upon measuring clusters like figure 1, I found that an average machine had about 25% of its memory in use, and about 50% fragmented. These numbers backup the situation depicted in the figure. Further, since these machines had an average of 4.5GB of memory, the 50% fragmentation left plenty of room for another process. However, in clusters like figure 2, about 25% memory is in use, but now only 5% - 10% is fragmented. In this case, the remaining fragmented memory only represents a few hundred MB of memory, and there aren't too many tasks which can fit in such a small memory footprint. Fortunately, well over 60% of the memory on these machines (in both clusters) is free, so other tasks could be scheduled into the free memory if the eviction policies of the cluster manager where modified. I will consider how we can maximize overall memory usage across the cluster by using better scheduling techniques and by placing "small" tasks in fragmented or free memory.

Better scheduling
Upon profiling the memory usage of tasks on a cluster, it can be seen that there are 2 distinct types of tasks: well behaved, and poorly behaved. Well behaved tasks consume nearly all of the resources which they request. Such applications generally have large caches or memory mapped files. Further, they generally account for the total amount of memory they have allocated to ensure they down allocate more then they have reserved. It may be the case that these processes allocate a large block of memory and the proceeds to waste it internally, but this is a degenerate case. I will not deal with as this is not a problem with the cluster, but rather a problem with the application author. Figure 3 depicts a process who is relatively well behaved. The average memory usage is approximately 1100MB and the maximum usage is approximately 1350MB (a difference of only 250MB). This is all about 5% below the allocation (shown as peak in the graph). As it can be seen by the 90th percentile line, memory spikes generally stay well below the max and peak.

Figure 3: Memory usage of a well behaved task
Figure 4 depicts a poorly behaved task where the average memory usage (1375MB) is well below the maximum (2000MB). Even though 90th percentile memory usage is only around 1500MB, the task clearly has memory usage spike which approach the allocation of 2000MB. Specifically, this task wastes about 500MB of memory on average.

Figure 4: Memory usage of a poorly behaved task
Clearly, if all tasks were well behaved we could schedule them to maximize memory usage because we can accurately predict how much memory they will use. However, from inspection of jobs submitted to the cluster, most jobs consist of mostly poorly behaved tasks. There is also another interesting correlation: poorly behaved tasks tend to be non-interactive. This gives us the freedom to slow, or at the limit, pause the task without having adverse effects on it's intended result. As an example, we are free to pause an off-line scientific computation though we are not allowed to pause a web server which is serving live traffic. Note that it is quite simple to pause a running task; all that needs to be done is to have the OS scheduler stop scheduling that particular process. The UNIX command nice(1) could be used for this purpose, but a modified kernel scheduler would probably be a better fit.

Given the ability to pause a running task, and slightly more information about the resource usage profile of that task, we can tightly bound the resource usage on a given node by sacrificing task running time. A simple approach would be to define the normal and peak resource consumption of a given task; this can be measured through previous runs of that task. We then say that a task is approaching its peak if it's usage exceeds 110% of its normal usage. Then, we can bound memory usage by only allowing one task which is approaching it's peak usage to run at a time. This then bounds total resource usage at the sum(normal usage) + max(peak - normal) + sum(normal * 110%). Further, if we impose a total order on tasks residing on a given node, we can ensure that we fairly service paused jobs by always having the scheduler consider them in order.

Figure 5: Memory usage of a modeled poorly behaved task
Figure 5 depicts a memory model of a typical poorly behaved, non-interactive process running in my simulation environment. This is the sort of process we would be willing to pause if its resource usage began to peak. I found, through measuring processes in the wild, that an average memory usage of 500MB and a peak usage of 1200MB is fairly reasonable. Further, in an attempt to model reality, the peaks occur based on a probability which varies with time. Figure 6 shows a simulated cluster node running 6 poorly behaved tasks who's properties are identical to the process depicted in Figure 5.

Figure 6: Memory usage of six modeled poorly behaved tasks
Based on this task's average usage, we know that at all times the node will have 3000MB of memory in use. However, at times when multiple tasks begin to peak, as much as 6000MB of memory may be in use. On a machine with more limited memory, such as the average cluster node which has only 4500MB of memory, such tasks could not coexist scheduled in the current manner.

Figure 7: Memory usage of six modeled poorly behaved tasks, only one task may "peak" at a time
Figure 7 shows the memory usage of a node implementing the proposed scheduler which only allows a single job to peak at a time. In this case, we have successfully bounded totally memory usage at approximately 4000MB which would fit on the average cluster node. However, we paid the price in running time for a given task. In a typical run of my simulated poorly behaved process, its resource usage peaks about 10 times. For simplicity, we can then assume that this corresponds to roughly 10 units of work. In the case of the aggressively scheduled processes, each process' memory usage only peaks 3 times representing a 3x longer running time for each task. Clearly this multiplier is heavily dependent on the number of processes on the machine and how often their resource usage peaks. However, as long as the task's normal and peak memory usage is defined well, this multiplier will be a small constant. Further, defining normal and peak usage for a task can be easily automated and thus can be defined quite accurately.
"Small" filler processes
The above approach works well if you have a large number of poorly behaved processes an no well behaved processes. Such a situation can be induced by quarantining known poorly behaved processes from all other processes. This may optimize resource utilization in the quarantined portion of the cluster but will still leave fragmented resources in the main part of the cluster.

Using a method similar to the method described above, we can schedule poorly behaved processes in the free (and possibly allocated) memory. From measurement, we can assume that about 10% of memory allocated by a well behaved process remains unused. Further, even with perfect scheduling, approximately 10% - 20% of memory on a given node remains unallocated. If the average node has approximately 4500MB of memory we can conservatively assume that about 450MB is unallocated and another 450MB is allocated but unused.

With this information we can define what sort of poorly behaved process we can schedule in this fragmented memory to increase utilization. Specifically, we can safely schedule a task who's normal memory usage is approximately 450MB and peak memory usage is approximately 900MB. From measurement of poorly behaved processes in the wild, I have found that many tasks with resources usage at or below these levels. Further, the majority of those tasks are non-interactive.

Since we are allowing these tasks to use memory reserved for another task we have to aggressively schedule them to ensure that other tasks remain uninterrupted. If we can assume that killing the poorly behaved task is allowed -- the cluster manager will restart it elsewhere and the task's output is not harmed -- then we have an easy solution: if the amount of free memory on the node dips below a certain threshold because of use by a well behaved task, kill the poorly behaved task. This approach is a bit heavy handed, but is the best way to ensure the quality of service promised to the well behaved task.

Another scheduling tactic might be to checkpoint and migrate the job. In this case, we need to leave ourselves enough time to move the checkpointed task assuming that it has been checkpointing itself continuously. Previous research has shown that moving a task consumes about 5 sec per megabyte of checkpointed state1. It can be assumed that progress in network connectivity and computational power may have reduced this number to 5ms (accounting for 3 orders of magnitude more network bandwidth: 10MBit/s versus 1GBit/s). Even with this cost, a task with 500MB of state will take 2.5s to move. This requires us to measure the maximum growth rate of a well behaved process and set the threshold for migrating a process to at least the amount of memory any well behaved process might be able to consume in 2.5s. Optimally, the well behaved tasks on the node would gradually use memory to give the scheduler plenty of warning to migrate the poorly behaved task. I have found that many well behaved tasks have this property, but more measurement needs to be done to ensure that such a scheduling strategy would not harm the well behaved task resident on the node.
Further Research
The simulator that was built is only useful if its process models are accurate. From measurements of tasks in the wild, the model which have been build are correct to a first order approximation. However, the simulation would be far more accurate if real resources utilization information could be used in place of probabilistic models. Then, the scheduler could really be put to the test against real tasks to see how it performs and how it effects the running time of the processes. Most of the data gathered up to this point has been single samples of a task's memory usage for each node and task in the cluster. I intend to randomly choose jobs and measure their usage for their entire lifetime to build better models. If the scheduler still shows promise after being tested on real task usage patterns, I will begin to build the necessary infrastructure to implement this scheduler on a real cluster.

Accurately and automatically modeling process memory usage is another important problem which needs to be solved. Both of these proposed modifications rely on accurate measurements of both normal and peak memory usage. Peak is trivial to measure, but "normal" memory usage is a bit more tricky. Specifically, values of "normal" must be defined such that a single scheduling algorithm (complete with tuning constants) can choose to slow or stop a process if its usage exceeds some threshold which is a function of this "normal" value.
Conclusion
It has been shown that there are vast amounts of resources (specifically memory) which are wasted on large clusters. Further, it is the case that some of these clusters can not accommodate new requests because of the wasteful behavior of requests which are being serviced. I have asserted that this is partially because of the contract that the cluster make with the user; namely, the task will always have the allocated resources available. I have proposed that if this requirement is relaxed, it is possible to more optimally increase overall resource utilization by increasing the running time of non-interactive tasks by a constant factor. Further, since this scheduling method will pack more tasks into a smaller memory footprint, it will allow more tasks to take advantage of the cluster, increasing overall computational throughput.
References
  1. Condor - A hunter of idle workstations, MJ Litzkow, M Livny - Distributed Computing Systems, 1988., 8th International
  2. Experience With The Condor Distributed Batch System M Litzkow, M Livny - IEEE Workshop on Experimental Distributed Systems, 1990
  3. Exploiting process lifetime distributions for dynamic load balancing, M Harchol-Balter, AB Downey - ACM Transactions on Computer Systems, 1997
  4. A Comparison of Preemptive and Non-Preemptive Load Distributing, P Krueger, M Livny - ICDCS, 1988
  5. Adaptive Load Sharing in Heterogeneous Distributed Systems, R Mirchandaney, DF Towsley, JA Stankovic - Journal of Parallel and Distributed Computing, 1990